February 12, 2019
Following a turbulent year for the British retail sector, we joined up with the UK’s national statistical institute, to deliver retail industry insight
At the end of January 2019, GS1 UK and the Office for National Statistics (ONS) collaborated to provide an analysis of the business landscape in front of an audience of UK retailers including Ocado, Sainsbury’s, John Lewis, New Look and Harrods.
Covering everything from peak spending trends to household borrowing rates, it provided a window into the current state of the retail industry for brands, retailers and suppliers of all sizes.
Shifting peaks
Among the emerging trends uncovered by ONS analysis, none was more revealing than the power of online to influence our societal spending patterns.
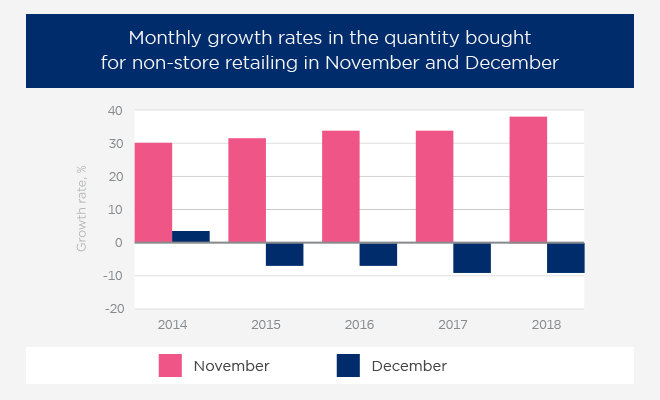
The arrival on UK shores of the Black Friday phenomenon has seen prodigious growth in online sales during the month of November, which has averaged about 30 per cent growth since 2014.
In contrast, the traditional peak month of December has seen a fall in monthly sales over the years (below), pointing to a concrete trend of seasonal shift in our buying habits.
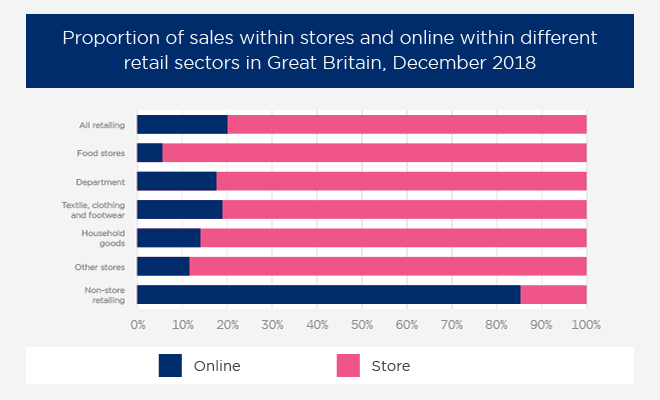
As well as the shift in peak trading, December 2018 also saw a new high in internet sales, with one fifth of all purchases made in the last month of the year coming solely from online payments (below).
Online and in-store preferences
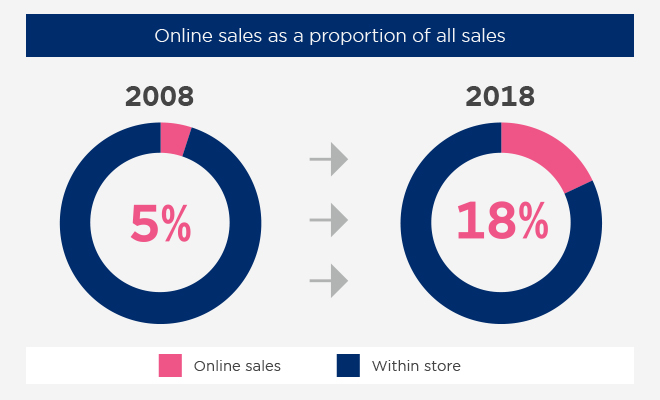
In the decade spanning 2008–2018, online spending as a proportion of all retail sales rose by 13 percentage points (below), with over 50p of every online pound spent with a virtual store that has no physical presence.
While statistics show that online has made significant strides in the retail space, it is evident that the British consumer still prefers to buy some products in a more conventional setting.
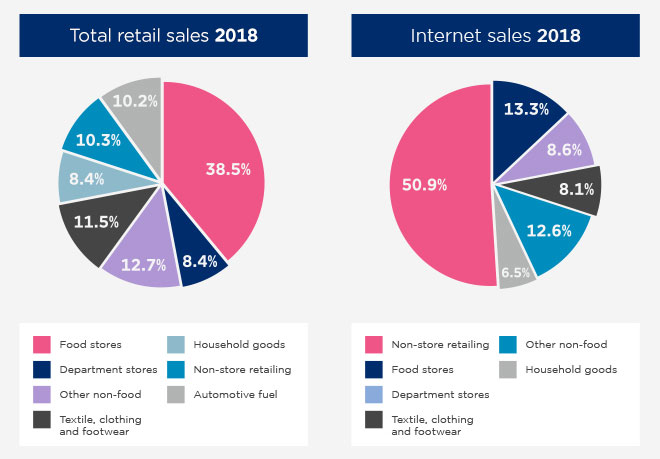
For example, almost 39p of every pound spent in retail was spent in food stores; for online only sales, this was just 13p in every pound. However, textile, clothing and footwear shopping was slightly higher as a percentage of online only spend, than it was as a percentage of total spend (below).
Retail live and kicking online
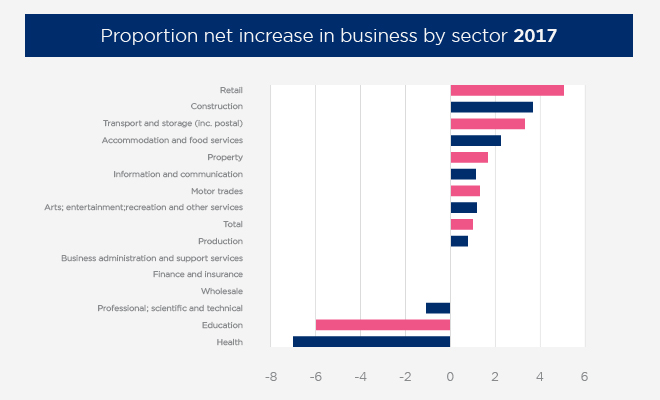
Despite a difficult year for traditional retailers, the online world provided better news for those in the sector. Retail saw the largest overall increase in the number of firms starting up in the UK in 2017 (below), largely due to a 25% increase in the number of online retailers.
These figures are bolstered by statistics from the Centre for Entrepreneurs that showed 2018 as the highest ever year for company formations, with more than 645,000 new businesses entering the market in a 12-month period.
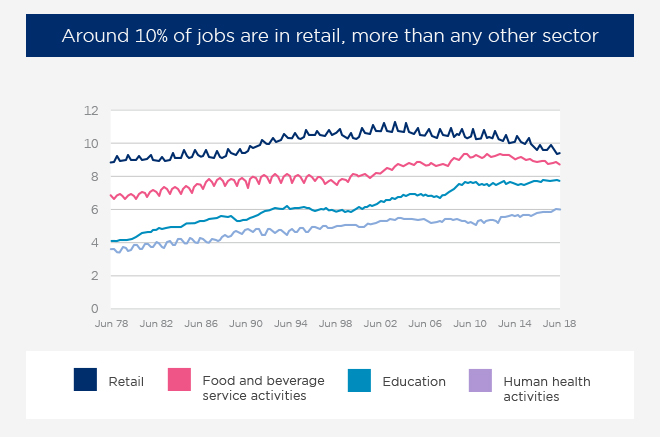
As well as retail seeing the biggest boost in terms of trading entities in 2018, the sector also employs more people than any other industry in the UK, with one in ten people now working across the industry (below).
Spending beyond our means?
Despite a general trend towards spending growth and a positive outlook for retail overall, figures show that the British consumer is feeling the pinch due to two main factors.
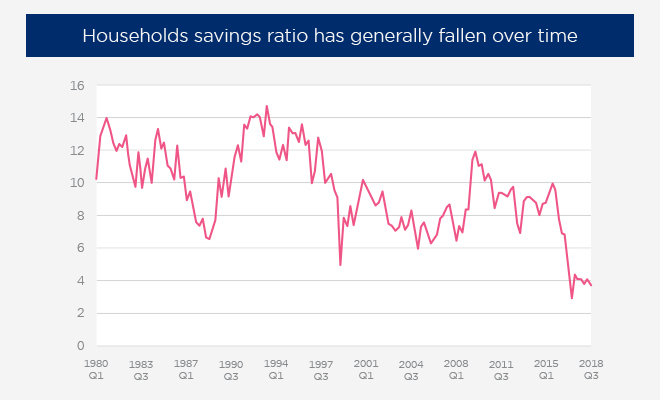
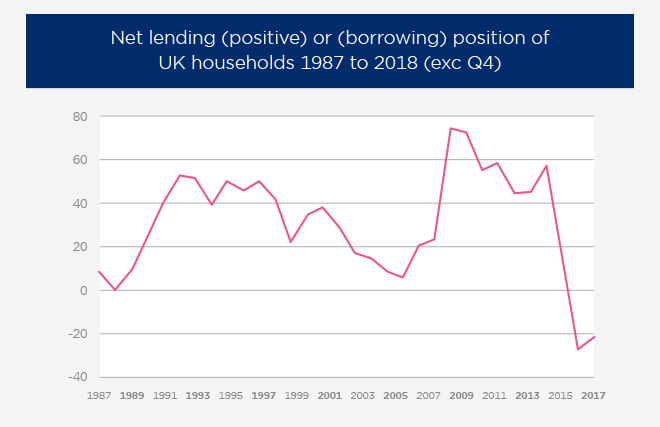
General savings hit their lowest ebb on record in 2017, and in 2018, UK households became net borrowers for the first time in thirty years (below), leaving the average consumer with much diminished disposable income.
If not abated, this two-pronged assault on the shopper could be a cause for concern as 2019 takes shape.
A transformational project
As the largest producer of official statistics, ONS have been collecting data to calculate vital economic indicators in the same way for decades, with a large percentage of information collated from household surveys and manual data entry.
In order to streamline and update their methodology for the digital age, ONS are now seeking to include point-of-sale scanner and online transaction data from retailers. Alongside web-scraped data, ONS hopes to use this information to enhance the speed, accuracy and granularity of a wide range of data.
GS1 UK’s product identifiers and revolutionary product data-sharing services, like productDNA, will contribute to this transformation by providing a base of accurate and consistent product information across retail channels.
For more information on the ONS transformation initiative and how retailers can help to contribute to a new solution for data collation and calculation, please contact commercial.data.team@ons.gov.uk.
To find out more about productDNA and the ground-breaking data-sharing platform that is unifying product data across the retail industry, please contact productdna@gs1uk.org.
Related
Eight things your business needs to do to break into China